Home / GDP Per Capita / Libya
Country Profile · GDP Per Capita · 2025
Libya GDP Per Capita
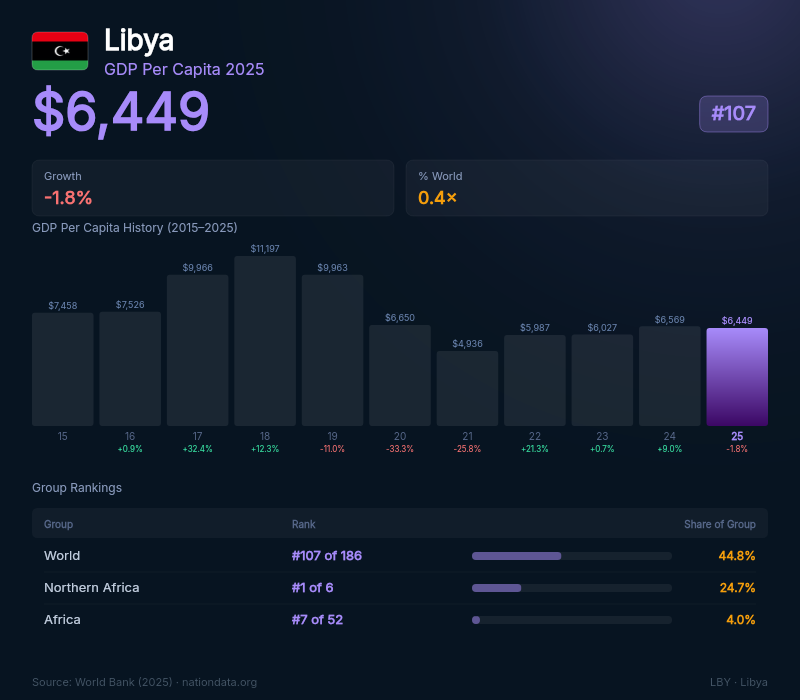
Libya's GDP per capita is $6,449 in 2025 — ranked #107 in the world.
$6,449
GDP per capita (2025)
-1.83%
Annual change
#107
World rank
↓ Download this data
Libya GDP per capita history (2015–2024), annual change and world rank. Excel and CSV.
Key figures
| Indicator | Value | Year |
|---|---|---|
| GDP per capita (current US$) | $6,449 | 2025 |
| Annual change | -1.83% | 2025 |
| World rank | #107 | 2025 |
| Ratio to world average | 0.4× | 2025 |
GDP per capita history
Year-by-year GDP per capita data for Libya.
| Year | GDP Per Capita | Change | Rank | vs Avg |
|---|---|---|---|---|
| 2025 | $6,449 | -1.83% | #107 | 0.4× |
| 2024 | $6,569 | +9.00% | #111 | 0.5× |
| 2023 | $6,027 | +0.67% | #118 | 0.5× |
| 2022 | $5,987 | +21.29% | #121 | 0.5× |
| 2021 | $4,936 | -25.78% | #124 | 0.4× |
| 2020 | $6,650 | -33.25% | #103 | 0.6× |
| 2019 | $9,963 | -11.02% | #91 | 0.9× |
| 2018 | $11,197 | +12.35% | #86 | 1.0× |
| 2017 | $9,966 | +32.42% | #87 | 0.9× |
| 2016 | $7,526 | +0.90% | #97 | 0.7× |
| 2015 | $7,458 | — | #98 | 0.7× |
FAQ
What is the GDP per capita of Libya?
Libya's GDP per capita is $6,449 in 2025, ranking #107 in the world.
How does Libya's GDP per capita compare to the world average?
Libya's GDP per capita is 45% of the world average.
About. GDP per capita figures from the World Bank's World Development Indicators. Full historical series (2015–2024) available in the download above.